The plot layout tool can be used to create a grid of new plots within a cruise stand. Keep in mind that this tool will create multiple features automatically. If there are required (non-nullable) fields, these values will need to be set on each plot before it can be successfully uploaded. One way to do this is to use default values in the data model. Another way is to use Configurable Defaults in MobileMap. Defaults can be combined with Configurable Defaults to provide a global default (in the data model) and a local default (for a specific user on their MobileMap device). In both cases, if defaults are found, the plot layout tool will apply them when creating new plots.
To use the plot layout tool, follow these steps:
Configure the tool in settings:
MobileMap Cruise > Enable Cruise Functionality - Check this box to enable cruise functionality, which is required for plot layout
MobileMap Cruise > Enable Creation of New Plots - Check this box to enable enable creation of new plots. This is required for manal plot creation and use of the Plot Layout tool
Plot Layout > Enable Plot Layout - Check this box to enable plot layout
Plot Layout > Stand Boundary Buffer - if a value greater than 0 is used here, the stand boundary will be buffered inward by the selected number of feet. This will prevent plots from being created along the stand boundary.
Plot Layout > Minimum Plot Count - Minimum number of plots per stand when using plot layout tool
Plot Layout > Maximum Plot Count - Maximum number of plots per stand when using plot layout tool
Plot Layout > Target Plot Density - Target plot density (area per plot, in currently selected area units) when using plot layout tool. To achieve a density of 1 plot for every 2 acres, enter a value of 2 in this field.
Plot Layout > Plot Density Field - Optional field name to read plot density value from, on a per stand basis, when using plot layout tool. Can be useful when different strata have different target densities
Plot Layout > Plot X:Y Ratio - Ratio of spacing in X to Y, in format of (X spacing):(Y spacing). Default is 1:1. To simulate pattern of 4 chain by 5 chain grid, use "4:5" (without quotes).
Plot Layout > Plot Starting ID - The plot ID, or plot number that will be used for the first plot. Examples are '1' or '123' (no quotes). You should only have to set this the first time you run the tool, internally the number will be auto-incremented each time a new plot is created with the Plot Layout tool. If you want to re-set the auto-increment value, set this field to the desired next plot.
Plot Layout > Use Diamond Layout - Check box to use a diamond layout pattern instead of square or rectangle
Data Model > Area Field - set this to the field in the stand feature layer that stores the area of the stand. This might be 'Area', 'Acres', 'Cruise_Acres', 'Net_Acres' or something different. MobileMap uses this field to calculate the number of plots to create
Lay Out Plots
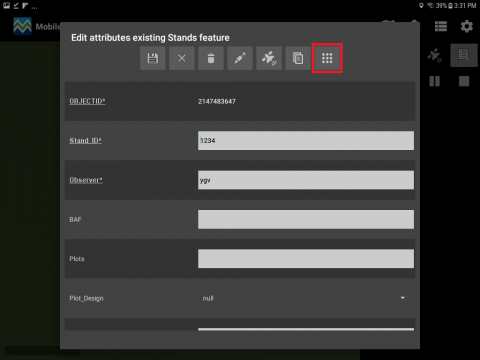
Select a stand for plot creation – Once the settings have been configured, begin plot creation by using the edit tool on the Stand layer and selecting an existing stand. Then select the plot layout icon (9 points, upper right of toolbar).

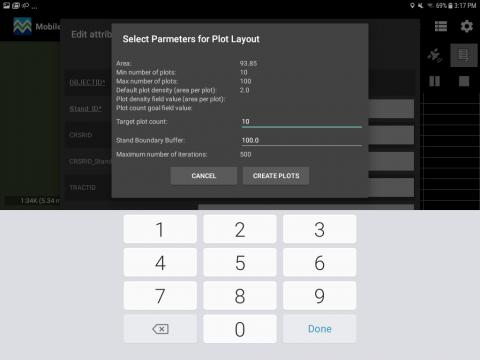
Review the area, minimum and maximum plots, plot density and target plot count information. The target plot indicates the number of plots that the tool will create. If this number does not seem right, edit it within the window by pressing the back cursor and type in the number of plots you prefer. Below is an example which shows it originaly had 47 plots but changed to 10 plots Press ‘CREATE PLOTS’. The tool will generate plots and report the number of plots created and the number of iterations that were needed to create the plots.


Select 'DONE' to return to the Stand attribute editor. Tap the Save icon to close the stand and begin collecting plot level data.
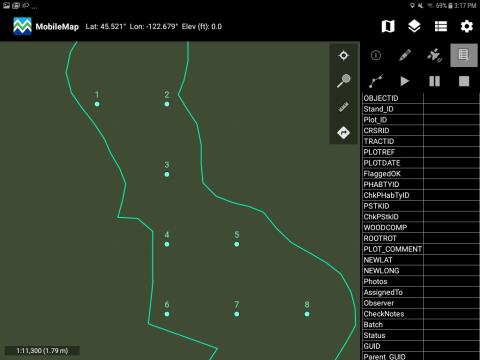
The number of plots now can be viewed within the stand alond with PLOT_ID number indicated next to them as labels. This can be set in the layers menu drop down for plots.


